All places › Canton of Solothurn › Wangen bei Olten
Municipality · Canton of Solothurn · 3'365 voters
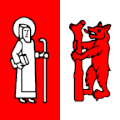
Wangen bei Olten
Wangen bei Olten votes slightly more right than Switzerland and about like Switzerland on society questions (popular votes 2022–2026). Since 1981 there is no clear movement.
Left ↔ Right · 2022–2026
Canton of Solothurn: −1.3 · trend since 1981: no clear trend
Per 5-year period. Solid: Wangen bei Olten; dashed: Canton of Solothurn. Line “CH” = Swiss result.
Liberal ↔ Conservative · 2022–2026
Canton of Solothurn: −2.7 · trend since 1981: no clear trend
Per 5-year period. Solid: Wangen bei Olten; dashed: Canton of Solothurn. Line “CH” = Swiss result.
ⓘ How these scores are calculated
National Council election 2023
Party share in Wangen bei Olten; the thin line shows Switzerland. Right: change since 2019.
Parties since 1971
Party share in every National Council election (every 4 years). How the election figures are made
Clear trends (p < 0.05): SVP +5.8 pts per 10 years · Mitte −3.6 pts per 10 years · FDP −3.3 pts per 10 years · SP −2.0 pts per 10 years · Greens +1.9 pts per 10 years.
Where Wangen bei Olten differed most from Switzerland
Popular votes of the last 10 years with the biggest difference to the Swiss yes share.
| Date | Vote | Wangen bei Olten | Switzerland |
|---|---|---|---|
| 9.2.2020 | Ban on discrimination based on sexual orientation | 45.4% yes | 63.1% yes |
| 23.9.2018 | «Fair Food Initiative» | 26.5% yes | 38.7% yes |
| 9.2.2020 | Initiative «More affordable homes» | 31.4% yes | 42.9% yes |
| 29.11.2020 | Initiative «For responsible businesses – protecting human rights and the environment» | 40.5% yes | 50.7% yes |
| 21.5.2017 | Energy Act | 49.6% yes | 58.2% yes |
Municipalities that vote alike
Bülach (ZH) Buchs (AG) (AG) Interlaken (BE) Emmen (LU) Feuerthalen (ZH) Unterseen (BE)