All places › Canton of Fribourg › Saint-Martin (FR)
Municipality · Canton of Fribourg · 749 voters
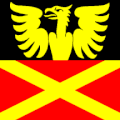
Saint-Martin (FR)
Saint-Martin (FR) votes more left than Switzerland and more conservative than Switzerland (popular votes 2022–2026). Since 1981, Saint-Martin (FR) has clearly moved: 3.0 pts per 10 years toward left.
Left ↔ Right · 2022–2026
Canton of Fribourg: +4.2 · trend since 1981: +3.0 pts per 10 years (clear)
Per 5-year period. Solid: Saint-Martin (FR); dashed: Canton of Fribourg. Line “CH” = Swiss result.
Liberal ↔ Conservative · 2022–2026
Canton of Fribourg: +1.4 · trend since 1981: no clear trend
Per 5-year period. Solid: Saint-Martin (FR); dashed: Canton of Fribourg. Line “CH” = Swiss result.
ⓘ How these scores are calculated
National Council election 2023
Party share in Saint-Martin (FR); the thin line shows Switzerland. Right: change since 2019.
Parties since 1971
Party share in every National Council election (every 4 years). How the election figures are made
Clear trends (p < 0.05): Mitte −5.4 pts per 10 years · Greens +3.7 pts per 10 years · SP +2.3 pts per 10 years.
Where Saint-Martin (FR) differed most from Switzerland
Popular votes of the last 10 years with the biggest difference to the Swiss yes share.
| Date | Vote | Saint-Martin (FR) | Switzerland |
|---|---|---|---|
| 23.9.2018 | Initiative «For food sovereignty» | 59.8% yes | 31.6% yes |
| 25.9.2022 | Act on the old-age insurance | 25.7% yes | 50.5% yes |
| 23.9.2018 | «Fair Food Initiative» | 63.2% yes | 38.7% yes |
| 24.11.2024 | Uniform financing of outpatient and inpatient services | 29.8% yes | 53.3% yes |
| 25.9.2022 | VAT increase in favour of the old-age insurance | 33.4% yes | 55.1% yes |
Municipalities that vote alike
Clos du Doubs (JU) Tavannes (BE) Avegno Gordevio (TI) Vallorbe (VD) Courgenay (JU) Locarno (TI)